Jessica writes:
![]() I am doing a behavioral study on a species of bird that has communal display sites called leks. I have set up a 10 meter grid of stakes across a lek, which I use to get x and y coordinates for marked birds on the lek throughout the morning. I have GPS coordinates for each of the stakes and would like to translate the ‘fake’ coordinates of my grid into real lat and long coordinates. Can you recommend the best way to do that?
I am doing a behavioral study on a species of bird that has communal display sites called leks. I have set up a 10 meter grid of stakes across a lek, which I use to get x and y coordinates for marked birds on the lek throughout the morning. I have GPS coordinates for each of the stakes and would like to translate the ‘fake’ coordinates of my grid into real lat and long coordinates. Can you recommend the best way to do that?![]()
Since you’re using a sampling grid with 10 meter intervals, the first thing you should do is adopt a mapping coordinate system that uses meters as well – UTM. Latitude and longitude are great for plotting spherical data, but for any type of X,Y data, you should switch to a metric grid system. You could use California State Plane coordinates, but UTM is probably an easier choice, and you can set your GPS to display UTM coordinates.
The next step is to create a 2D coordinate transform, between your sampling grid coordinates, and the UTM coordinate system. This is actually a lot easier than it sounds – you’re just solving two equations that map X,Y data from your sampling grid to Easting and Northing coordinates in UTM. You’ll need to know the UTM coordinates of the four corner points in your sampling grid. The first should be the zero point, where x and y are 0 in your sampling grid. The second is at the corner (the upper left corner) where y is at maximum, and x is zero. The third point should be at the opposite corner, where x and y are at their maximum. The fourth is in the lower right corner, where x is at maximum, and y is zero.
Solving the Projection Equations
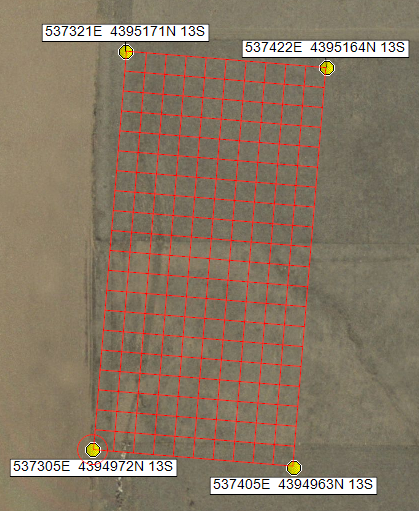
You have to solve two equations. The equation for Easting is: Easting = Ax + By + C. The equation for Northing is: Northing = Dx + Ey + F. C and F are easy to determine – these are the Easting and Northing values at point 1, where x and y are both equal to zero. Because x is zero, the Ax term is also zero. Same for By. So the equation simplifies to Easting = C at the point [0,0]. And you’ve used your GPS to determine the UTM coordinates at [0,0] are 537305E, 4394972N. So C and F are solved for.
Now consider the upper left point, where x = 0 and y = 200 meters. Because x is zero, the equations simplify to Easting = By + C. We’ve already determined C = 537305E. y = 200. And the UTM Easting at this point is 537321E. So the equation becomes 537321E = B*200 + 537305E. Subtract 537305E from both sides, and then divide by 200. B = 0.08
Do the same thing to solve for E at this point. Then consider the opposite point, where y is zero, and x is 100 meters. Use the same technique to solve for A and D.
Converting your x,y grid to UTM in Excel
Once you’ve solved for A, B, C, D, E, and F, you’re ready to convert your x,y data into UTM coordinates. Excel or another spreadsheet program is an easy way to do this. You’ve got your x,y data in two columns. Create two more columns, Easting and Northing. Create a formula for the values in Easting using the equation Easting = Ax + By + C. Same thing for Northing.
Now you’re finally ready to map your data. Excel is applying the two formulae to convert x,y data to UTM, using the six constants (ABCDEF) you calculated. Select your data from Excel, making sure you’ve got the Easting and Northing values as well as the name or label for each data point. Paste this into the Waypoint List in ExpertGPS. Select UTM, WGS84 as your coordinate format (click Add if this format doesn’t appear), and be sure to specify that your coordinates are in two columns (Easting and Northing). Enter the UTM zone (it’s 13 in the example above). On the next screen, you’ll tell ExpertGPS which columns of Excel data contain the Easting and Northing. Once you’ve done this, ExpertGPS will map your data, and you should see your sampled data points appear on the map right where they should be.
Need Help?
That’s probably more math than you want to think about, but the good news is you only have to do it once, and then let the computer do the rest. Those two equations are at the heart of all the mapping features in ExpertGPS – every time you zoom in or scale the map or even move the mouse, ExpertGPS is converting back and forth between the arbitrary x,y coordinate system of your computer monitor and the UTM geographic coordinate system. If you run into trouble, I’m happy to help. Send me the data you’re using in spreadsheet format, as well as the coordinates of the four corners of your sample grid, as well as its dimensions.
Setting up a sampling grid using the Grid Builder in ExpertGPS Pro
See that red rectangular grid in the example above? That’s the Grid Builder tool in ExpertGPS, superimposing a 10-meter sampling grid over the map. The next time you’re setting up a sampling grid using GPS and a map, this tool might save you some time.
Also, if this is for a non-US location, you can use ExpertGPS to
convert your data to KML to view in Google Earth:
The View in Google Earth command in ExpertGPS allows you to view your
GPS data (waypoints, routes, and tracks) over the detailed color
imagery in Google Earth. To use the command, open a GPX file in
ExpertGPS, or retrieve the data from your GPS. Press F7, or click
View in Google Earth on the Go menu. ExpertGPS will instruct Google
Earth to synchronize its map to match the map in ExpertGPS, and to
show your GPS data.
If Google Earth is not already running when you click View in Google
Earth, it may not show your data because it is busy initializing. To
prevent this, run Google Earth and let it finish initializing and zoom
in on the globe. Then click View in Google Earth in ExpertGPS.
You can also export your data from ExpertGPS to a KML file, which you
can then view in Google Earth. Click on the map in ExpertGPS, and
then click Export Data on Map on the File menu. Change the file type
to .kml, and save to your desktop. Open the KML file in Google Earth.
ExpertGPS cannot display Google Earth’s worldwide color imagery
directly. Google’s terms of use forbid this. You can, however,
export an image from Google Earth and use it as a Scanned Map in
ExpertGPS.
The ExpertGPS help file has complete details about preparing and
geo-referencing your maps for use within the program.
https://www.expertgps.com/help/calibrating-a-scanned-map.asp
To get rid of the warning message that your data is outside of the
United States, which appears when you are in Topo Map or Aerial Photo
Map view, click Show Quick Map or Show Scanned Map on the Go menu.
Quick map will display GPS or GIS data for any point in the world over
a white background.